
01Services
Full-Service MLS®
HDR photos, drone, video, print — all in.
Buyer's Agency
Sharp data, clear negotiation.
Rental Management
Leasing, screening, tenant care.
Advisory
Investment strategy backed by data.
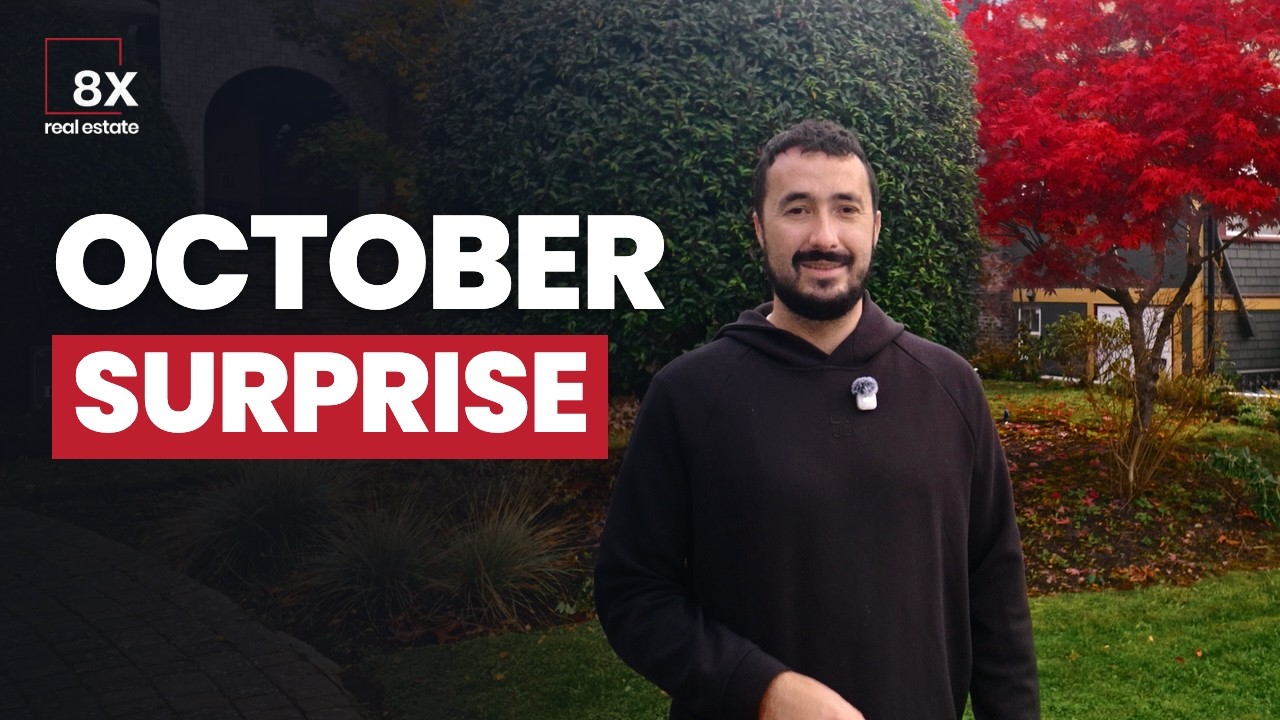

October 2026 in one paragraph
October 2026 in Greater Victoria: buyers came back, prices did not move. 467 homes sold in October, up 22% from 382 in September, while new listings fell 25% to 927. The median house sold for $1,166,500, −0.7% from October 2025 (245 vs 299 sales). The median condo sold for $514,500, −3.8% (124 vs 147 sales), and the median townhome for $770,700, −3.0% (81 vs 76 sales). Homes sold for 97.7% of asking, the same as a year earlier. Compared with October 2025, house and condo sales were lower and townhome sales were higher.
Source: 8X Real Estate analysis of VREB MLS® data, 13 core municipalities, residential only, pulled November 3, 2026. The board's own count was 573 sales.
Members see the sales behind these numbers, street by street.
Create a free accountWatch
Market gauge
Months of inventory is the number of homes for sale divided by the average monthly sales pace over the last three months. Under 4 favours sellers, 4 to 6 is balanced, over 6 favours buyers. It is the same measure used on every 8X area page.
01 · Sales
382 homes sold in September; 467 sold in October. House sales rose by a third, 184 to 245. Townhome sales rose by half, 53 to 81. Condos went from 127 to 124, essentially flat. Against October 2025, though, house and condo sales were still lower; only townhomes were up.
Our series starts June 2024, so the Oct average covers two prior Octobers. New listings fell from 1,239 in September to 927 in October, down 25%.
02 · Prices
With buyers back, prices did not jump. The median house was −0.7% on a year ago, and the board's own benchmark for a typical Victoria core house rose 0.7% to $1,288,600. Two measures, the same answer: flat.
| Type | Median | Change | Sales | Of asking | Over asking | Days | For sale | Months |
|---|---|---|---|---|---|---|---|---|
| Houses | $1,166,500 | −0.7% | 245 vs 299 | 97.7% | 11.8% | 30 | 956 | 4.4 |
| Condos | $514,500 | −3.8% | 124 vs 147 | 97.3% | 7.3% | 35 | 863 | 6.5 |
| Townhomes | $770,700 | −3.0% | 81 vs 76 | 99.1% | 28.4% | 35 | 415 | 6.6 |
In real money: houses sold for 97.7% of asking, so a house listed at $1,000,000 typically sold for about $977,000. Days is the median from listing to accepted offer.
Our count vs the board's
The Victoria Real Estate Board reported 573 sales for October, up 24% from September. Our 467 covers the 13 core municipalities from Sooke to Sidney and residential sales only: houses, condos and townhomes. We leave out the Gulf Islands, Malahat and Shawnigan Lake, leasehold, land, manufactured homes and commercial sales, all of which the board's total can include. Different map, same direction.
03 · This month's feature
In the City of Victoria, the median sale price for all homes fell 13% from October 2025. It sounds dramatic. Look inside it and houses were flat and condos slipped.
What changed was the mix. Last October, 42 houses sold in the City of Victoria; this October, 28. Fewer houses in the basket and more condos pulls the middle of the basket down, even when neither price moves much. When you see a big number, ask: a big number for what?
04 · Around the region
The map opens on months of inventory for all homes, the same buyer's or seller's market measure as the gauge above, using August to October so every area has enough sales. Switch to prices by type or to homes for sale against last year.
Pins mark the two areas where the balance between buyers and sellers moved most against last year, scored on the change in months of inventory allowing for sample size. Downtown condos are on the map every month.
| Municipality | Type | Median | Change | Sales |
|---|---|---|---|---|
| Victoria | Houses | $1,283,100 | +0.2% | 28 vs 42 |
| Saanich | Houses | $1,182,500 | +1.2% | 83 vs 87 |
| Langford | Houses | $966,000 | −7.8% | 33 vs 38 |
| Oak Bay | Houses | $1,660,000 | −5.1% | 14 vs 27 |
| Victoria | Condos | $506,000 | −4.5% | 60 vs 68 |
| Saanich | Condos | $532,500 | −3.6% | 18 vs 24 |
| Langford | Condos | $499,900 | −7.6% | 21 vs 20 |
| Langford | Townhomes | $689,900 | −2.5% | 19 vs 20 |
The table repeats the single-month medians from the video. The map uses three months of sales, August to October against the same months last year, so more areas clear our 10-sale minimum; where three months is not enough it uses six and says so. Each name links to its municipality page.
Sold prices by street for October are open to members.
Create a free account05 · Off the MLS
BC Assessment reports every sale registered at the Land Title Office, whether or not it was listed. We check each one against MLS® records. Between July 2 and September 29, 2026, 1,926 residential sales were registered in Greater Victoria, and 195 of them (10.1%) had no matching MLS® listing.
| Type | No MLS® match | Share |
|---|---|---|
| Houses (incl. suites) | 54 of 896 | 6.0% |
| Condos | 85 of 663 | 12.8% |
| Townhomes | 39 of 254 | 15.4% |
| Duplexes | 10 of 75 | 13.3% |
If you only follow MLS® numbers, you miss about one sale in ten across the region, and closer to one in five in Langford and Esquimalt. The median registered price was $850,000 for sales with no MLS® match (195 sales) and $900,000 for matched sales (1,731). For houses: $1,112,500 (54) vs $1,196,500 (842).
See private and off-market sales across Greater Victoria
Source: BC Assessment Monthly Sales Report (file received October 13, 2026), licensed to 8X, aggregates only. Dates are Land Title Office registration dates, which can trail the sale by weeks or months, and the latest month in each file is incomplete. BC Assessment sends a new file about two weeks after each month ends, and this section updates when it arrives.
06 · On the ground
Buyers are back. They're just not in a hurry. When buyers come back, sellers don't raise prices the next morning. They wait to see if the traffic is real. And it's fall: some of what's still listed is what didn't sell in the spring, and some of those are worth a second look.
Dustin Miller, managing broker
07 · What it means
Send me the address and I'll pull what sold, what's for sale and what it means for you.
Send me the address or call 778-678-9815Questions
It depends on the type. Houses were balanced at 4.4 months of inventory. Condos (6.5) and townhomes (6.6) were in buyer's market territory, and downtown condos were at 6.7. Under 4 months favours sellers, 4 to 6 is balanced, over 6 favours buyers.
The median house sold for $1,166,500 in October 2026, −0.7% from October 2025 (245 vs 299 sales).
The median condo sold for $514,500 in October 2026, −3.8% from October 2025 (124 vs 147 sales).
The median townhome sold for $770,700 in October 2026, −3.0% from October 2025 (81 vs 76 sales).
Flat to slightly down. All three types sold within 4% of October 2025: houses −0.7%, condos −3.8%, townhomes −3.0%. The board's benchmark for a Victoria core house rose 0.7%.
467 homes sold in the 13 core municipalities, up 22% from 382 in September. The Victoria Real Estate Board, which covers a wider area, reported 573.
The median house sold in 30 days, condos and townhomes in 35. 11.8% of houses, 7.3% of condos and 28.4% of townhomes sold over asking. Houses sold for 97.7% of asking on average.
We count residential sales (houses, condos, townhomes) in the 13 core municipalities from Sooke to Sidney. The board's total also includes the Gulf Islands, Malahat, Shawnigan Lake, leasehold, land, manufactured homes and commercial sales.
In sales registered between July 2 and September 29, 2026, 195 of 1,926 residential sales (10.1%) had no matching MLS® listing, based on BC Assessment's sales report.
Data and method
Previous month: August 2026 market update. Data for every municipality: Market Intelligence.

Dustin Miller is the managing broker of 8X Real Estate. When he's not on the road, he is on his computer looking at real estate. You can often find Dustin at his office enjoying a bowl of won-ton soup.



Get notifications for sales in this building. 👇


