

monthly market update
Victoria Real Estate Market Update: August 2026
Greater Victoria's inventory barely moved in August — total listings finished within 1.5% of last August. What is inside it changed completely: detached down 13%, townhouses up 30% to the highest count in our record. And on the one price measure that survives a shifting sales mix, all three property types are cheaper than a year ago.
watch
Townhomes Flood The Victoria Real Estate Market
The inventory rotation, the wave of brand-new townhouses behind it, and what sale-price-versus-assessed-value says about where the region is actually firm.
One number in the video has moved. We filmed on 3 September, when August showed 466 sales; this page was built on 9 September and August now reads 484. Nothing was wrong either time — most of August's deals were firm but not completed when we recorded, and have been completing since. A recent month is provisional in a way an older one is not, which is the caution the video ends on. Every figure below is the 9 September count.
at a glance
Greater Victoria, August 2026
Townhouse listings, month end
384
▲ 30.2% vs Aug 2025 · highest in our record
Detached listings, month end
974
▼ 13.1% — 147 fewer homes
Median $ per sq. ft.
$590
▼ 3.0% · $608 and $609 the two Augusts before
Sales
484
▲ 5.2% vs Aug 2025 · 35 days to sell, 12% over asking
the short version
- The shelf rotated; it did not grow. Total month-end listings fell 1.5%, 2,333 to 2,298. Underneath: detached −13.1%, condo +3.1%, townhouse +30.2%.
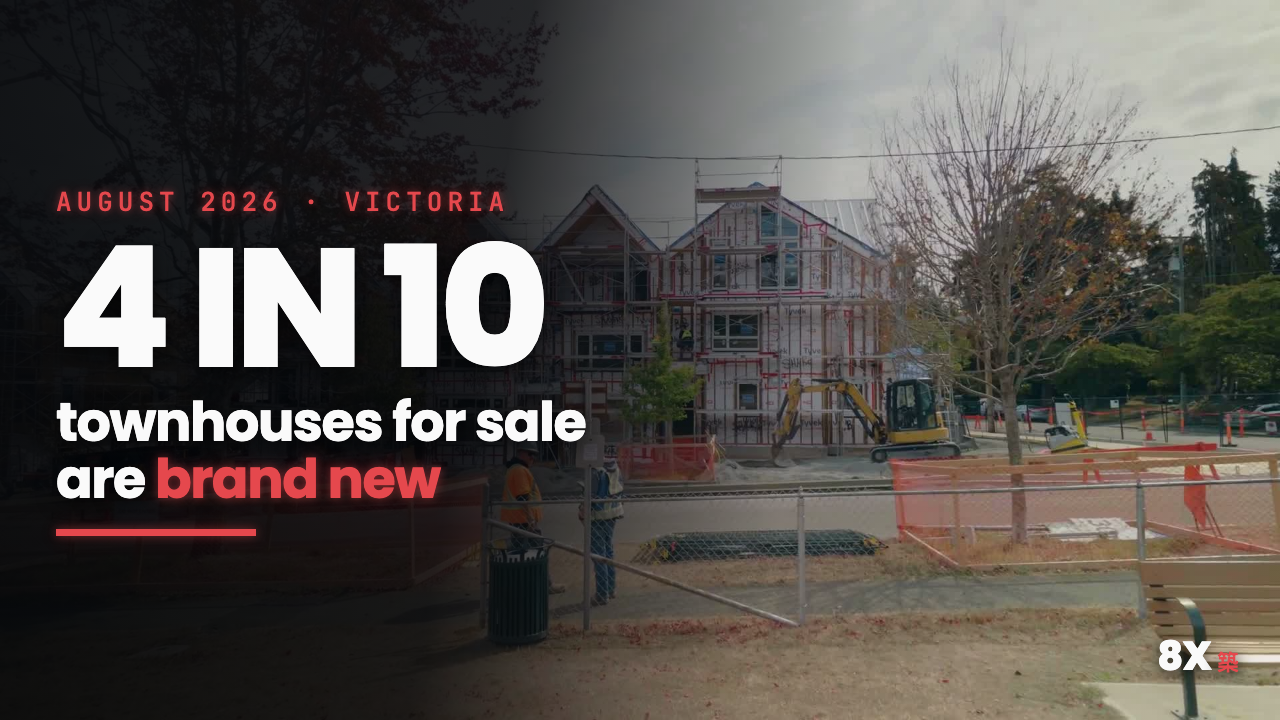
- Four in ten townhouses for sale are brand new. 153 of 386 active townhouses were built in 2025 or later. For condos it is two in ten. This is buildings finishing, not owners deciding to sell.
- New product sells slower. Over twelve months a new-build townhouse took a median 43 days to find a buyer; resale took 28. New construction is 40% of the townhouse shelf and 23% of the year's townhouse sales — that gap is the pile.
- Prices are down, and the headline hides it. The blended all-types median rose 2.8% — higher than every one of its own parts. Per square foot: detached −1.9%, condo −2.6%, townhouse −7.6%.
- Competition concentrated rather than returned. 12% of sales went over asking, identical to last August — but the median paid over asking nearly doubled, $10,100 to $20,000. And nearly twelve points separate the firmest neighbourhood from the softest: Vic West 105.8% of assessed value, Langford Proper 94.1%.
01 · prices
The Victoria median rose 2.8%. Ignore it.
Blend every residential sale in Greater Victoria into one median and August comes out at $924,500 against $898,950 a year ago — up 2.8%. That number will be quoted all month. It is the least informative figure on this page, and here is the proof: it is higher than every segment it is built from.
A blend that beats all of its parts is not measuring price
Change in median sale price, August 2026 against August 2025, by property type.
Sales behind each bar: all types 484 (460 last August), single family 241 (228), condo 157 (148), townhouse 63 (66) — every pair clears our ten-sale minimum. A median taken where half of sales are detached homes near $1.2M and a third are condos near $515K measures where the boundary between those groups falls, not what anything is worth.
Why we are not giving you one Victoria price this month
A median is a price signal only when the thing measured holds still. In August it did not: detached fell 1.9% per square foot while townhouses fell 7.6%, and the mix shifted underneath both. So we publish the segments instead, plus the measure that is hardest to fool. If you want one sentence: Victoria housing got cheaper in August, and the more square footage you were buying, the less that was true.
02 · prices, properly
Per square foot, all three property types are down
Price per square foot is not immune to mix, but it is far more robust than a median — it does not care whether a month happened to sell more houses than condos. Greater Victoria came in at $590. The two previous Augusts were $609 and $608; this is the first of the three to break the pattern.
Median price per square foot — Greater Victoria, by property type
Jul 2024 – Aug 2026, one point per completed month. Note the axis begins at $500.
- Single family
- Condo
- Townhouse
Median $/sq.ft. of finished area. Every month clears the ten-sale minimum; the thinnest is December 2025 at 296 sales. August's condo reading of $642 is the second-lowest of the 26 shown; townhouse $521 sits within $6 of its own low.
| Property type | Sales | Median price | YoY | $/sq.ft. | YoY | Days | Over ask |
|---|---|---|---|---|---|---|---|
| Single family | 241 | $1,198,000 | +2.6% | $579 | −1.9% | 34 | 13% |
| Townhouse | 63 | $749,900 | −9.3% | $521 | −7.6% | 35 | 17% |
| Condo (all) | 157 | $515,000 | −3.7% | $642 | −2.6% | 36 | 6% |
| — 1-bedroom | 45 | $395,000 | −13.2% | $661 | −9.9% | 43 | 4% |
| — 2-bedroom | 102 | $572,000 | +1.2% | $612 | −1.6% | 36 | 7% |
| — With parking | 147 | $530,000 | −2.8% | $642 | −2.6% | 36 | 7% |
| All types | 484 | $924,500 | withheld | $590 | −3.0% | 35 | 12% |
Every row clears ten sales at both ends; the thinnest pair is one-bedroom condos, 45 against 47, so read that −13.2% as directional. Condo sub-types overlap: a two-bedroom with parking appears in three rows. Region-wide sale-to-list was 97.7%.
Fewer bidding wars, but bigger ones
12% of sales closed over asking — exactly last August's share. What changed is the size of the win: the median paid over list was $20,000, against $10,100 last August and $15,600 in July. Competition did not broaden; it concentrated on less product.
Sellers are meeting the market
The median sale closed at 97.7% of its final asking price (98.0% last August) and at 99.2% of assessed value — the list price is doing the negotiating, not the offer. And 23.2% of sales took at least one price cut first, up from 21.0% in July. We do not compare that cut rate to last August: how we capture reductions changed in June 2026.
03 · supply
Total inventory barely moved. What is in it moved a lot.
Greater Victoria finished August with 2,298 active listings against 2,333 a year earlier — 35 homes, across thirteen municipalities. Read the headline and nothing happened. Read the composition and the market looks structurally different from a year ago.
Month-end active listings — the 13 municipalities, by property type
Jul 2024 – Aug 2026. The townhouse line is at the highest level of any month plotted.
- Single family
- Condo
- Townhouse
Both ends of every comparison use the same month-end measure, so 2026 and 2025 sit on one basis. Detached and condo follow the usual seasonal arc — spring peak, December trough. The townhouse line stopped following it: instead of falling back through summer, it turned up.
| Property type | Active | YoY | New | YoY | Sales | YoY | MoI† |
|---|---|---|---|---|---|---|---|
| Single family | 974 | −13.1% | 411 | −6.4% | 241 | +5.7% | 4.0 |
| Condo | 840 | +3.1% | 317 | +10.8% | 157 | +6.1% | 5.4 |
| Townhouse | 384 | +30.2% | 157 | +44.0% | 63 | −4.5% | 6.1 |
| All types | 2,298 | −1.5% | 928 | +7.3% | 484 | +5.2% | 4.7 |
† Months of inventory = month-end active listings ÷ that month's sales, computed from the two columns beside it. A year ago it read 4.9 detached, 5.5 condo, 4.5 townhouse and 5.1 overall — so detached tightened, townhouse loosened by a third. "All types" includes duplex and a small residual, so the rows do not sum to the total. Townhouse sales (63, and 66 last August) are the thinnest pair on this page — the supply figures behind them, 384 against 295, are what carries the finding.
04 · the cause
Four in ten townhouses for sale are brand new
A 30% jump in listings usually means owners decided to sell. This one does not. We pulled the build year on every active townhouse in the thirteen municipalities: 153 of 386 were built in 2025 or later — 386 on the day we queried against 384 captured at month end, because the shelf moves daily. For condos the figure is 169 of 856, two in ten, half the rate. The missing middle everyone was promised has arrived, and it arrived all at once.
It is finishing, not listing
106 of those townhouses carry a 2026 build year and four carry 2027, so they cannot be standing yet. 84 of the 153 are listed under a developer project name rather than a board area code — Snapdragon, Echo, Fairway Gardens, Poetry at Royal Bay, Twelve Cedars, The Hub at Vic West. That is how new and pre-sale product comes to market.
The arrival rate tripled, and not only in the Westshore
Of the townhouses newly listed in August, 35 were built this year; in August 2025 it was 8. That counts arrivals rather than the accumulated pile. Langford holds 57 of the new units and Saanich 33 — no surprise. The surprise is Victoria with 16 and Oak Bay with 14, more than Colwood's 13.
05 · the mechanism
New townhouses take 43 days to sell. Resale takes 28.
Over the twelve months to August, new-build townhouses across Greater Victoria sold in a median 43 days. Resale townhouses sold in 28. Same property type, same region, same year — fifteen days apart. That gap is why the pile is growing.
| Cohort | Sales | Median price | Median days to sell | Share of listings | Share of sales |
|---|---|---|---|---|---|
| Built 2025 or later | 174 | $842,500 | 43 | 40% | 23% |
| Resale | 596 | $775,000 | 28 | 60% | 77% |
Both cohorts clear the ten-sale minimum widely. Sales are completed transactions only, so recent months are undercounted — equally for both, which is why the comparison holds. Share of listings is the active shelf at 2 September 2026.
One thing this does not explain
It is tempting to say new construction dragged the townhouse median down 9.3%. The arithmetic runs the other way: new builds sell for more than resale — $842,500 against $775,000 — so a rising new-build share pushes a median up. Both facts are true; they are not cause and effect.
The consequence is competitive, not statistical: if you own a fifteen-year-old townhouse, your competition is no longer the identical unit three doors down. It is a show home with a warranty, a decorating allowance and a developer who can afford to wait.
06 · geography
Nearly twelve points of spread between the firmest and softest neighbourhoods
The most useful regional map is not price — expensive areas are expensive for reasons that have nothing to do with this month. It is sale price against BC Assessment value, because every property in the region sits on the same roll at the same moment. Vic West cleared 105.8% over the past three months; Langford Proper 94.1%.
Sale price as a share of BC Assessment value, by neighbourhood
Trailing three months, June – August 2026. Only neighbourhoods with 25 or more qualifying sales are shown; each bar carries its sample.
A trailing three-month window, because no neighbourhood clears our ten-sale minimum in August alone. All nineteen share the 2026 assessment roll, which is what makes comparing them fair — and why no year-over-year figure appears on this measure anywhere on this page: August 2025 sat on the 2025 roll, so a yearly move would mix the market with the assessment.
Fast and expensive are different things
Gordon Head and Fairfield West are two of the three quickest markets we track — 21 and 23.5 days — yet both sit essentially at assessed value, mid-table. South Oak Bay takes 47 days, nearly the slowest here, and still clears 102.1%. Speed measures demand depth; the assessed ratio measures price. People mix those up constantly.
Where the softness actually is
The four softest are Langford Proper (94.1%), Tillicum (94.9%), Quadra (95.5%) and Downtown (95.6%). Three of the four are condo-dominated — three-month medians of $515,000, $470,000 and $512,500 — the neighbourhood-level echo of section 02.
07 · municipalities
Homes sold faster than last August in six of eleven municipalities
The 35-day regional median hides a 33-day spread: Sidney sold in 17 days, Colwood took 50. Days-to-sell improved year over year in six of the eleven municipalities large enough to compare and held flat in two more — the quiet counterpoint to everything above. For most of the region, August was not slow.
| Municipality | Sales | Median price‡ | Days | vs Aug 2025 | Active | MoI† | Over ask | To assessed |
|---|---|---|---|---|---|---|---|---|
| Saanich | 131 | $1,059,000 | 29 | −3 | 490 | 3.7 | 11% | 97.1% |
| Victoria | 92 | $775,000 | 35 | −5 | 487 | 5.3 | 10% | 100.7% |
| Langford | 81 | $759,900 | 40 | +2 | 480 | 5.9 | 16% | 95.6% |
| Oak Bay | 31 | $1,550,000 | 35 | 0 | 95 | 3.1 | 16% | 100.8% |
| Sooke | 27 | $855,000 | 49 | −8 | 188 | 7.0 | 4% | 101.5% |
| Sidney | 25 | $930,000 | 17 | −5 | 71 | 2.8 | 8% | 105.3% |
| Colwood | 20 | $925,000 | 50 | +16 | 104 | 5.2 | 20% | 100.1% |
| Central Saanich | 19 | $999,900 | 34 | −5 | 96 | 5.1 | 11% | 102.7% |
| North Saanich | 19 | $1,600,000 | 49 | 0 | 79 | 4.2 | 11% | 106.8% |
| View Royal | 16 | $881,000 | 24 | −17 | 66 | 4.1 | 6% | 96.2% |
| Esquimalt | 15 | $735,000 | 37 | +6 | 113 | 7.5 | 13% | 97.7% |
| Metchosin | 5 | $1,670,000 | 52 | n/a | 19 | 3.8 | n/a | n/a |
| Highlands | 3 | $1,225,000 | 40 | n/a | 10 | 3.3 | n/a | n/a |
| All 13 | 484 | — | 35 | −1 | 2,298 | 4.7 | 12% | 99.2% |
† MoI = active listings ÷ sales, both in this table. Per-municipality new listings are omitted for width; the region total was 928. ‡Municipal medians are levels, not trends. We publish no year-over-year price change per municipality for the same reason we withhold the regional one: the mix of what sold in one municipality in one month swings hard. Victoria's all-types median reads 26% above last August purely on mix — that is not a price move and we will not print it as one. Metchosin (5 sales) and Highlands (3) are greyed on purpose, both under the ten-sale minimum, so levels only. Days comparisons appear only where both Augusts cleared ten sales.
Tightest markets
- Sidney — 17 days and 2.8 months of inventory: the fastest and tightest municipality in the region. It also cleared 105.3% of assessed value, second only to North Saanich.
- Oak Bay — 3.1 months on 31 sales, up from 19 last August and 21 the August before, its best of the three Augusts we hold.
- View Royal — 24 days, seventeen faster than last August, the biggest improvement on the list.
Loosest markets
- Esquimalt — 7.5 months of inventory. 15 sales against 113 listings; the clearest buyer's market in the region this month.
- Sooke — 49 days and 7.0 months, though eight days faster than last August.
- Colwood — 50 days, sixteen slower year over year and the slowest median on the list.
08 · what to do
What August means for September
If you're selling
- Townhouse owners: you are not competing with your neighbour. Four in ten townhouses on the market are brand new, priced roughly $67,000 above resale and taking 43 days. Price against the new stock's effective price, after incentives — not its list price.
- Detached owners have the strongest hand in two years. Listings are down 13% and months of inventory fell from 4.9 to 4.0. If you were waiting for less competition, this is it.
- Neither the headline nor your assessment is a price. "Victoria is up 2.8%" is a mix artifact — per square foot your segment is down between 1.9% and 7.6%. And the region cleared only 99.2% of assessed value, with eight of the nineteen neighbourhoods above under 100%. Anchor to either and you overprice.
If you're buying
- Townhouses are the best-supplied segment in the region. 6.1 months of inventory against 4.0 for detached, and a median down 9.3%. If the form works for you, this is where the leverage is.
- New-build inventory is negotiable in ways resale is not. A developer carrying unsold units in a finished building pays for them every month. Ask what is available beyond price — appliance packages, fees, rate buydowns.
- 88% of sales did not go over asking, unchanged in a year — but where you do compete, the median winning margin is now $20,000, so decide quickly. The softest large segment stays condos: $642 per square foot, down 2.6%, one-bedrooms down 13.2%, Downtown and Quadra under 96% of assessed.
common questions
Victoria market questions, answered with August data
Did Victoria home prices go up or down in August 2026?
Down, in every property type, once you correct for sales mix. Median price per square foot across Greater Victoria was $590 against $608 a year earlier, a 3.0% decline: single family $579 (−1.9%), condo $642 (−2.6%), townhouse $521 (−7.6%). Median sale prices say the same except for detached — single family $1,198,000 (+2.6% on 241 sales), condo $515,000 (−3.7% on 157), townhouse $749,900 (−9.3% on 63). The blended all-types median of $924,500 is up 2.8%, but it is higher than every segment it is made of, which makes it a mix artifact rather than a price signal.
Why are there so many townhouses for sale in Victoria right now?
Because buildings are finishing, not because owners are selling. Townhouse listings across the 13 Greater Victoria municipalities hit 384 at the end of August 2026, up 30.2% from 295 a year earlier and the highest count in our record. 153 of the 386 active townhouses were built in 2025 or later — four in ten, against two in ten for condos. Of the townhouses newly listed in August, 35 were built this year, against 8 in August 2025.
How long does it take to sell a house in Victoria BC?
The median Greater Victoria home sold in 35 days in August 2026, based on 484 sales — one day faster than August 2025 and two faster than July 2026. Single-family homes took 34 days, townhouses 35, condos 36. By municipality it ranged from 17 days in Sidney to 50 in Colwood, and days-to-sell improved year over year in six of the eleven municipalities with enough sales to compare, holding flat in two more.
What is the median condo price in Victoria BC?
The median Greater Victoria condo sold for $515,000 in August 2026 on 157 sales, down 3.7% from $535,000 a year earlier. One-bedroom units had a median of $395,000 (45 sales, down 13.2%) and two-bedroom units $572,000 (102 sales, up 1.2%). Condos averaged $642 per square foot, down 2.6% and the second-lowest reading in our 26-month record.
data & method
- Source and basis: 8X Real Estate market intelligence on Victoria Real Estate Board MLS® data via Repliers, pulled 9 September 2026 — the data behind our Market Intelligence dashboard. "Greater Victoria" means the 13 Capital Regional District municipalities: residential, duplex included, excluding land, manufactured homes and leasehold. No board-published count appears on this page.
- August is provisional. Most of the month's transactions were firm but not completed when we filmed on 3 September; the count has risen from 466 to 484 since. A recent month keeps arriving in a way an older one does not, and we would rather show that than hide it.
- Minimum sample: no percentage change is published where either compared period had fewer than 10 sales. Metchosin (5) and Highlands (3) are levels only.
- Three comparisons we deliberately do not make: year-over-year sale-to-assessed (August 2025 sits on the 2025 assessment roll, August 2026 on the 2026 roll — the level and the comparison between areas are sound, a yearly move is not); price reductions across June 2026 (our capture changed that month); and any year-to-date percentage (our figure and two board figures disagree materially on scope, so direction only).
- Definitions. Days on market is the median, not the mean, list date to accepted offer — boards commonly publish a mean, which runs roughly fifteen days higher on the same market. Sold prices are VOW-licensed: aggregates are free to publish, individual prices only after BC Assessment verification. Our series begins June 2024; charts start July 2024 because the first month's active-listing capture was incomplete.
Own a townhouse and wondering what just happened?
We will pull the new-build inventory competing with your unit, what it is actually closing at after incentives, and what pricing gets you sold this autumn rather than next spring.
let's chat